Gas Law experiment
Is there a relationship between volume and pressure?
Boyle-Marriotte Law:
 Robert Boyle, was born in Waterford in ireland (1627). He was a pioneer chemist and he was one of the founders of the Royal Society in London. He was known for the law which relates the volume and the preassure which he formulated with Edme Marriotte.
Preassure is inversely proportional to preassure and vice versa. This is because preassure is caused by many small collisions of gas particles with the sides of a container. So when there is a constant number of particles hittng within a volume, when you reduce that volume, the particles will hit that smaller area much faster.

In this animation we can see how preassure increases with volume.
This chart represents the Relationship between volume and pressure
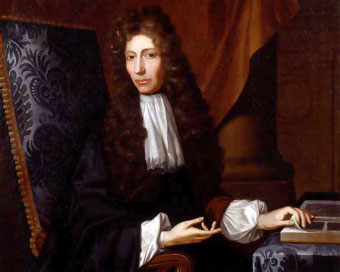 Robert Boyle, was born in Waterford in ireland (1627). He was a pioneer chemist and he was one of the founders of the Royal Society in London. He was known for the law which relates the volume and the preassure which he formulated with Edme Marriotte.
Preassure is inversely proportional to preassure and vice versa. This is because preassure is caused by many small collisions of gas particles with the sides of a container. So when there is a constant number of particles hittng within a volume, when you reduce that volume, the particles will hit that smaller area much faster.
P · V = k
P is preassure
V is volume
k is a constant.
This chart represents the Relationship between volume and pressure
Volume (ml)
|
1/Volume
|
Pressure (hPa)
|
65
|
0,015384615
|
0
|
64
|
0,015625
|
25
|
63
|
0,015873016
|
50
|
62
|
0,016129032
|
75
|
61
|
0,016393443
|
75
|
60
|
0,016666667
|
75
|
59
|
0,016949153
|
100
|
58
|
0,017241379
|
100
|
57
|
0,01754386
|
125
|
56
|
0,017857143
|
150
|
55
|
0,018181818
|
175
|
54
|
0,018518519
|
200
|
53
|
0,018867925
|
225
|
52
|
0,019230769
|
250
|
51
|
0,019607843
|
275
|
50
|
0,02
|
300
|
49
|
0,020408163
|
325
|
48
|
0,020833333
|
350
|
47
|
0,021276596
|
400
|
46
|
0,02173913
|
450
|
45
|
0,022222222
|
475
|
44
|
0,022727273
|
500
|
43
|
0,023255814
|
550
|
42
|
0,023809524
|
575
|
41
|
0,024390244
|
600
|
40
|
0,025
|
625
|
39
|
0,025641026
|
650
|
38
|
0,026315789
|
750
|
37
|
0,027027027
|
750
|
36
|
0,027777778
|
850
|
35
|
0,028571429
|
900
|
34
|
0,029411765
|
925
|
33
|
0,03030303
|
1000
|
32
|
0,03125
|
1050
|
31
|
0,032258065
|
1075
|
30
|
0,033333333
|
1200
|
29
|
0,034482759
|
1250
|
28
|
0,035714286
|
1275
|
27
|
0,037037037
|
1450
|
26
|
0,038461538
|
1550
|
25
|
0,04
|
1675
|
24
|
0,041666667
|
1800
|
23
|
0,043478261
|
1950
|
22
|
0,045454545
|
2000
|
21
|
0,047619048
|
2200
|
20
|
0,05
|
2250
|
Volume vs. Pressure graph

1/Volume vs Pressure graph

As we can see with the results given, everytime the volume is reduced the pressure would increase. So they are inversaly related. We can see that this happens in the Boyle-Marriott Law. Each time we decrease the volume, we reduce the area where the gas particles hit, the particles would be closer together and they would move faster, therefore there would be a higher pressure.
Bibliography:
Grc.nasa.gov (2013). Boyle's Law .. Animated. [online] Retrieved from: http://www.grc.nasa.gov/WWW/K-12/airplane/aboyle.html [Accessed: 30 Nov 2013].
(Animation)
Benson, T. (2008). An animation showing the relationship between pressure and volume when amount and temperature are held constant. [image online] Available at: http://www.grc.nasa.gov/WWW/K-12/airplane/aboyle.html [Accessed: 30 Nov 2013].

Excellent graphs! You need an introduction and more detail on the Boyle-Marriot Law that we were investigating. Can you find the equation for it?
ReplyDelete